Decision dossier · exampleCircuit board, U1 at 1 W
The question
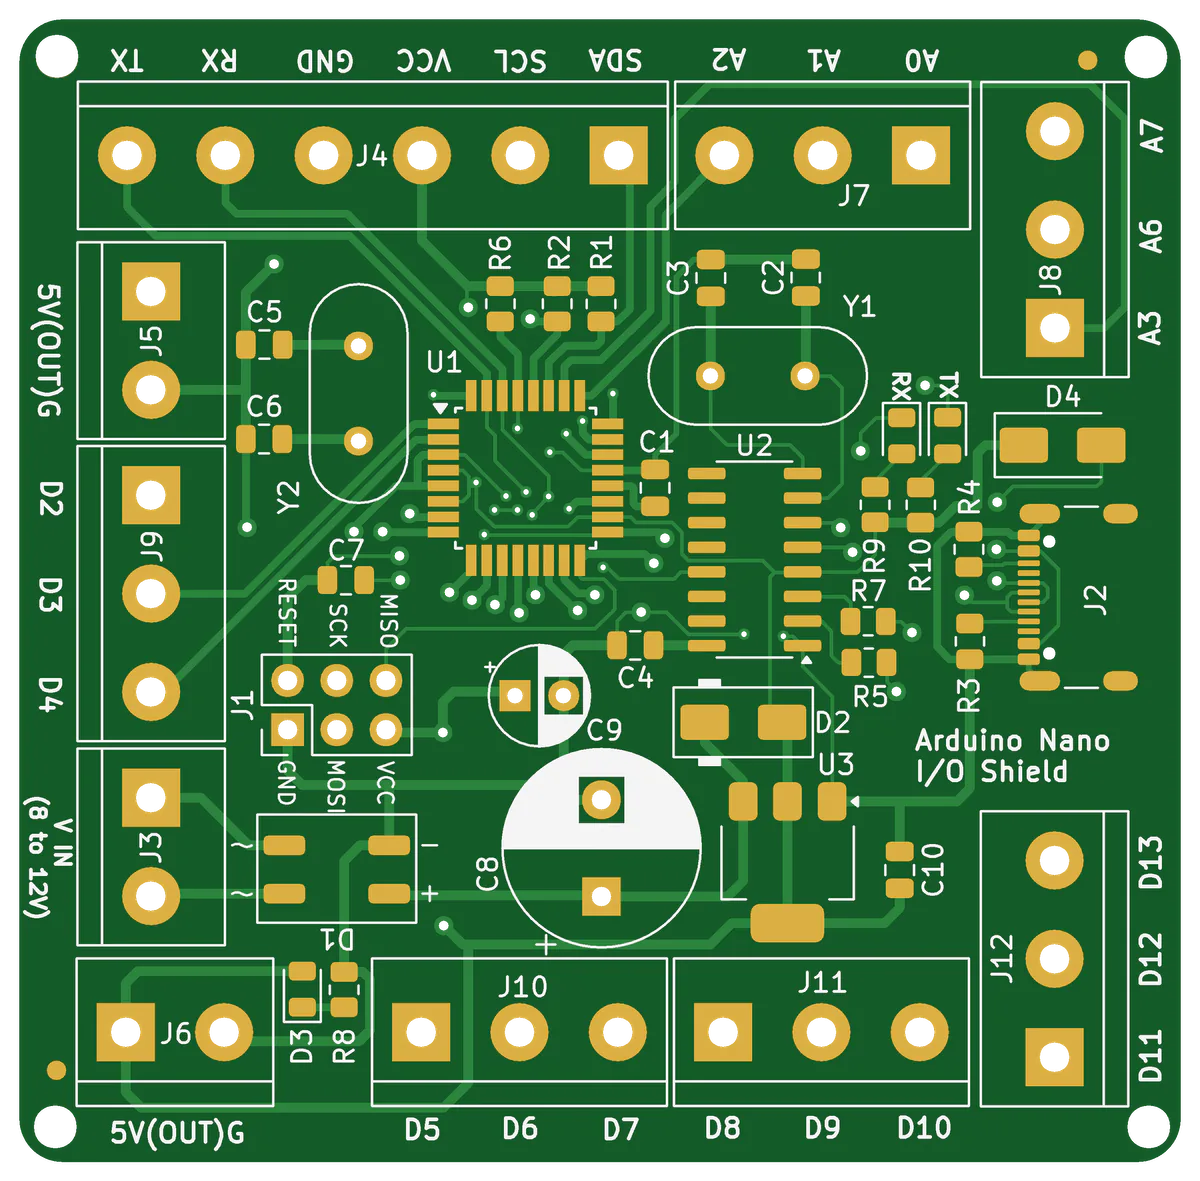
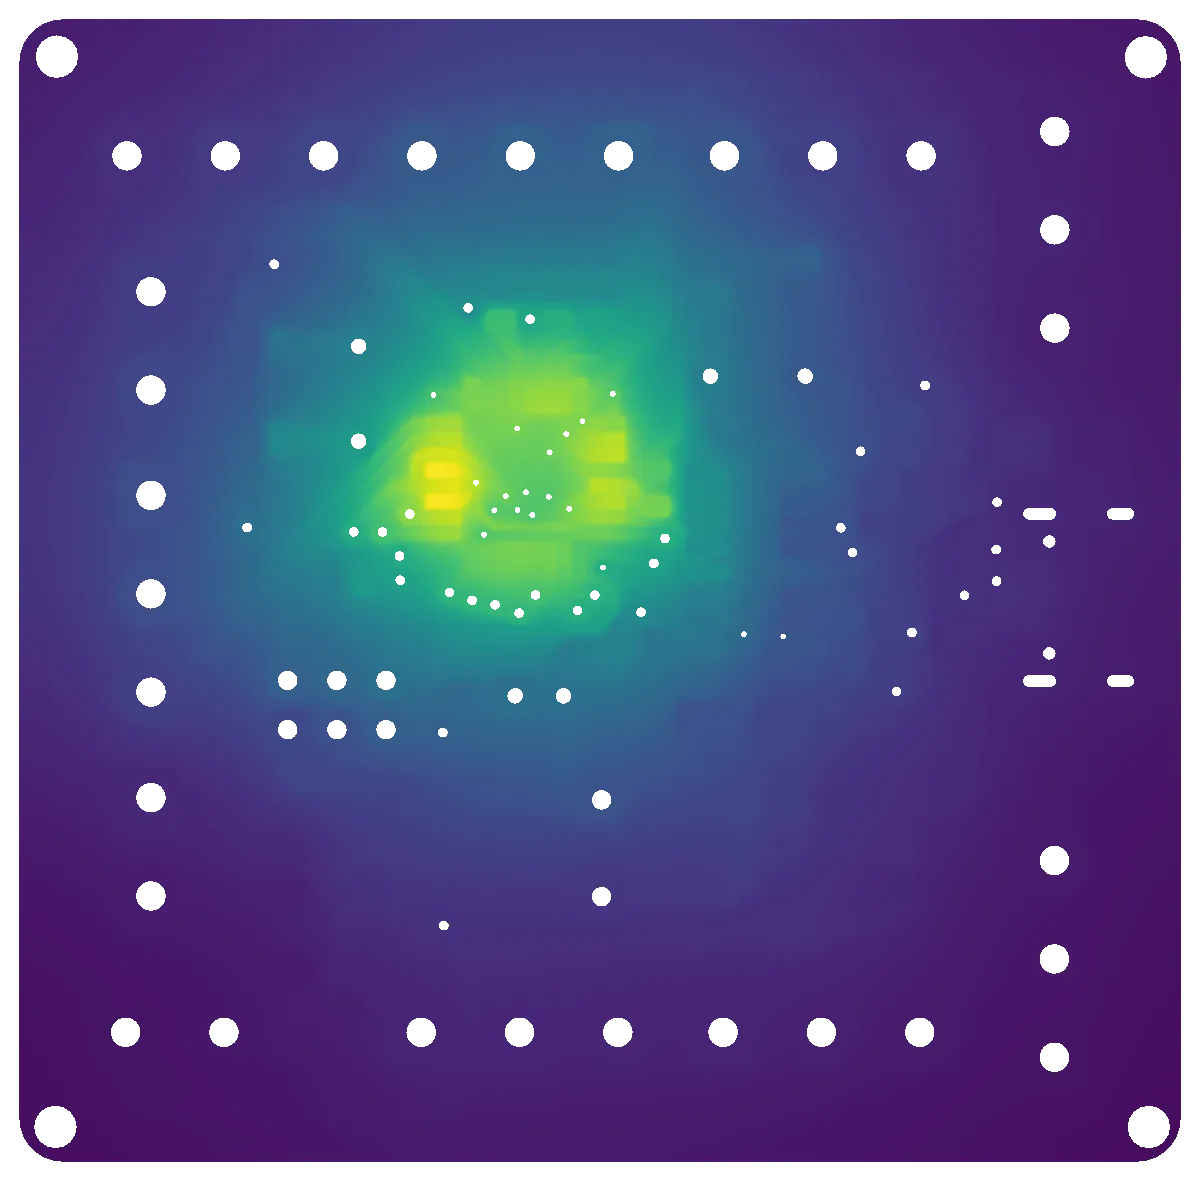
How hot does the microcontroller run at 1 W?
The answer
+53.6 KAbove ambient, at the hottest U1 pad. 90 % of it is reached within 132 s.
Your call: compare it with the part's temperature limit at your ambient. See the full analysis
Decision dossier · exampleDemo spool SPDM-D-0001, drive end
The question
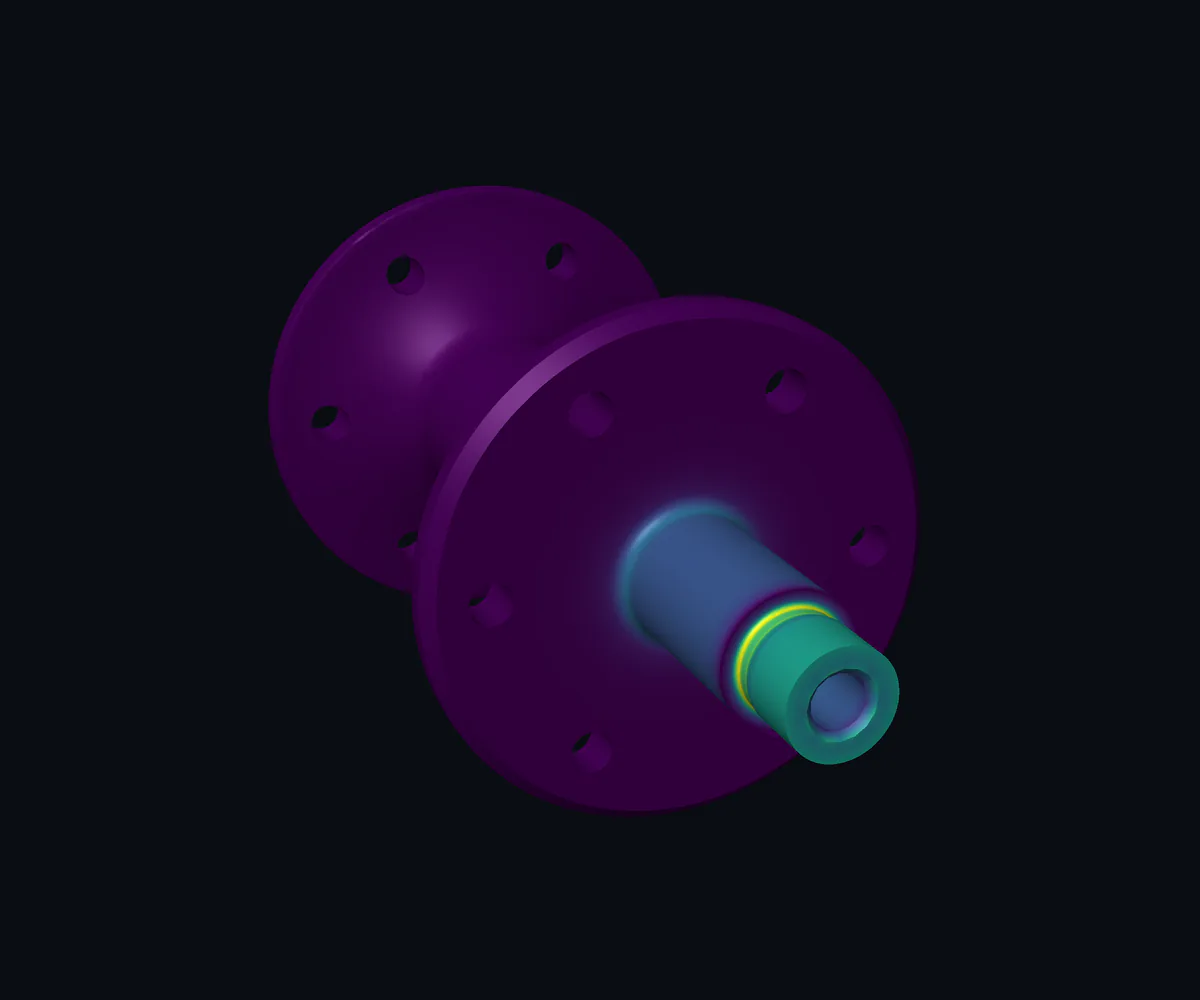
What does an 8 N·m peak do to the shaft?
The answer
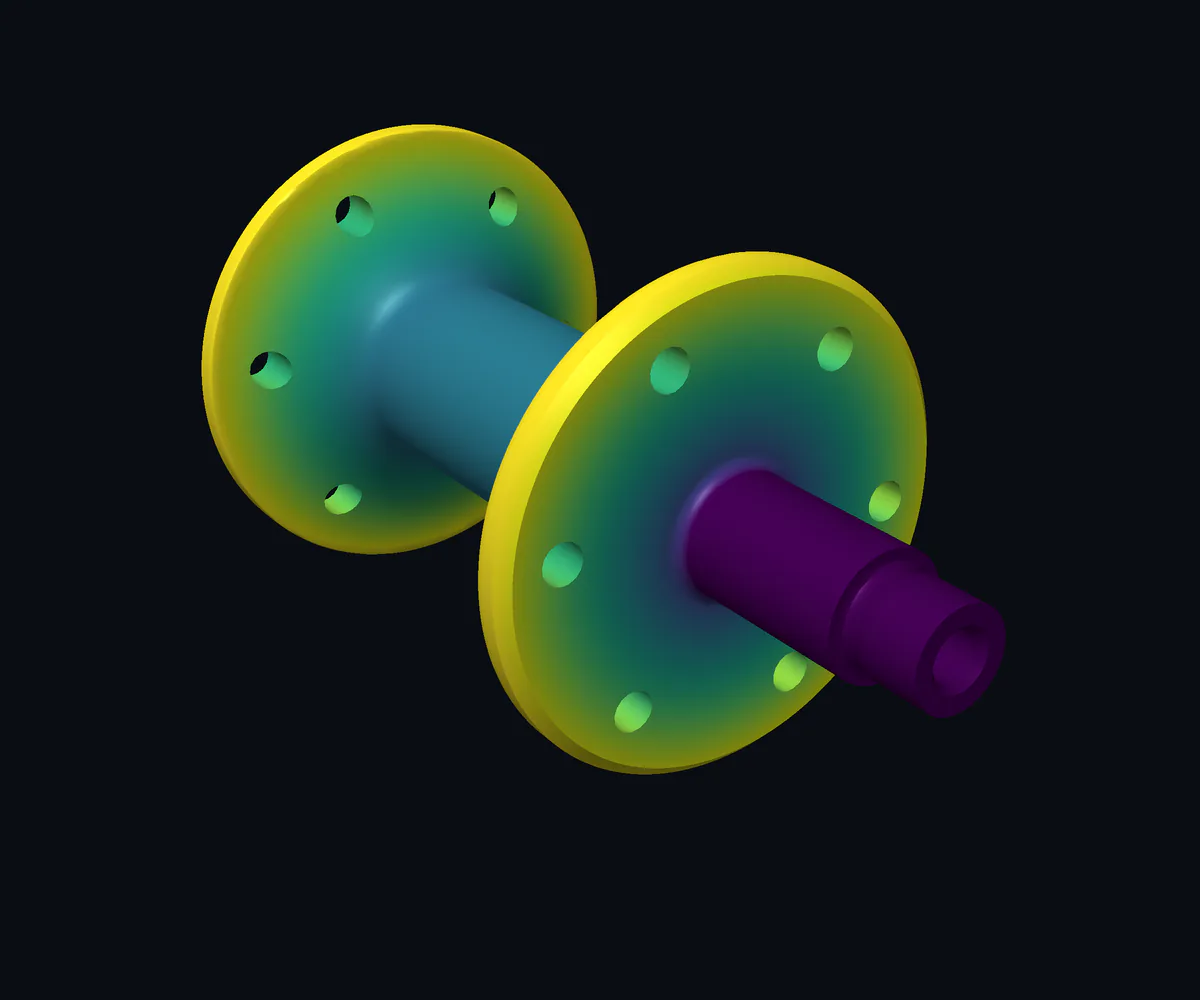
269 MPaHighest stress, in the R0.4 undercut at the shaft shoulder.
Your call: the verdict needs your yield strength and safety factor.
Capability · Drawings to 3D models
Your 2D drawings are machine-readable now.
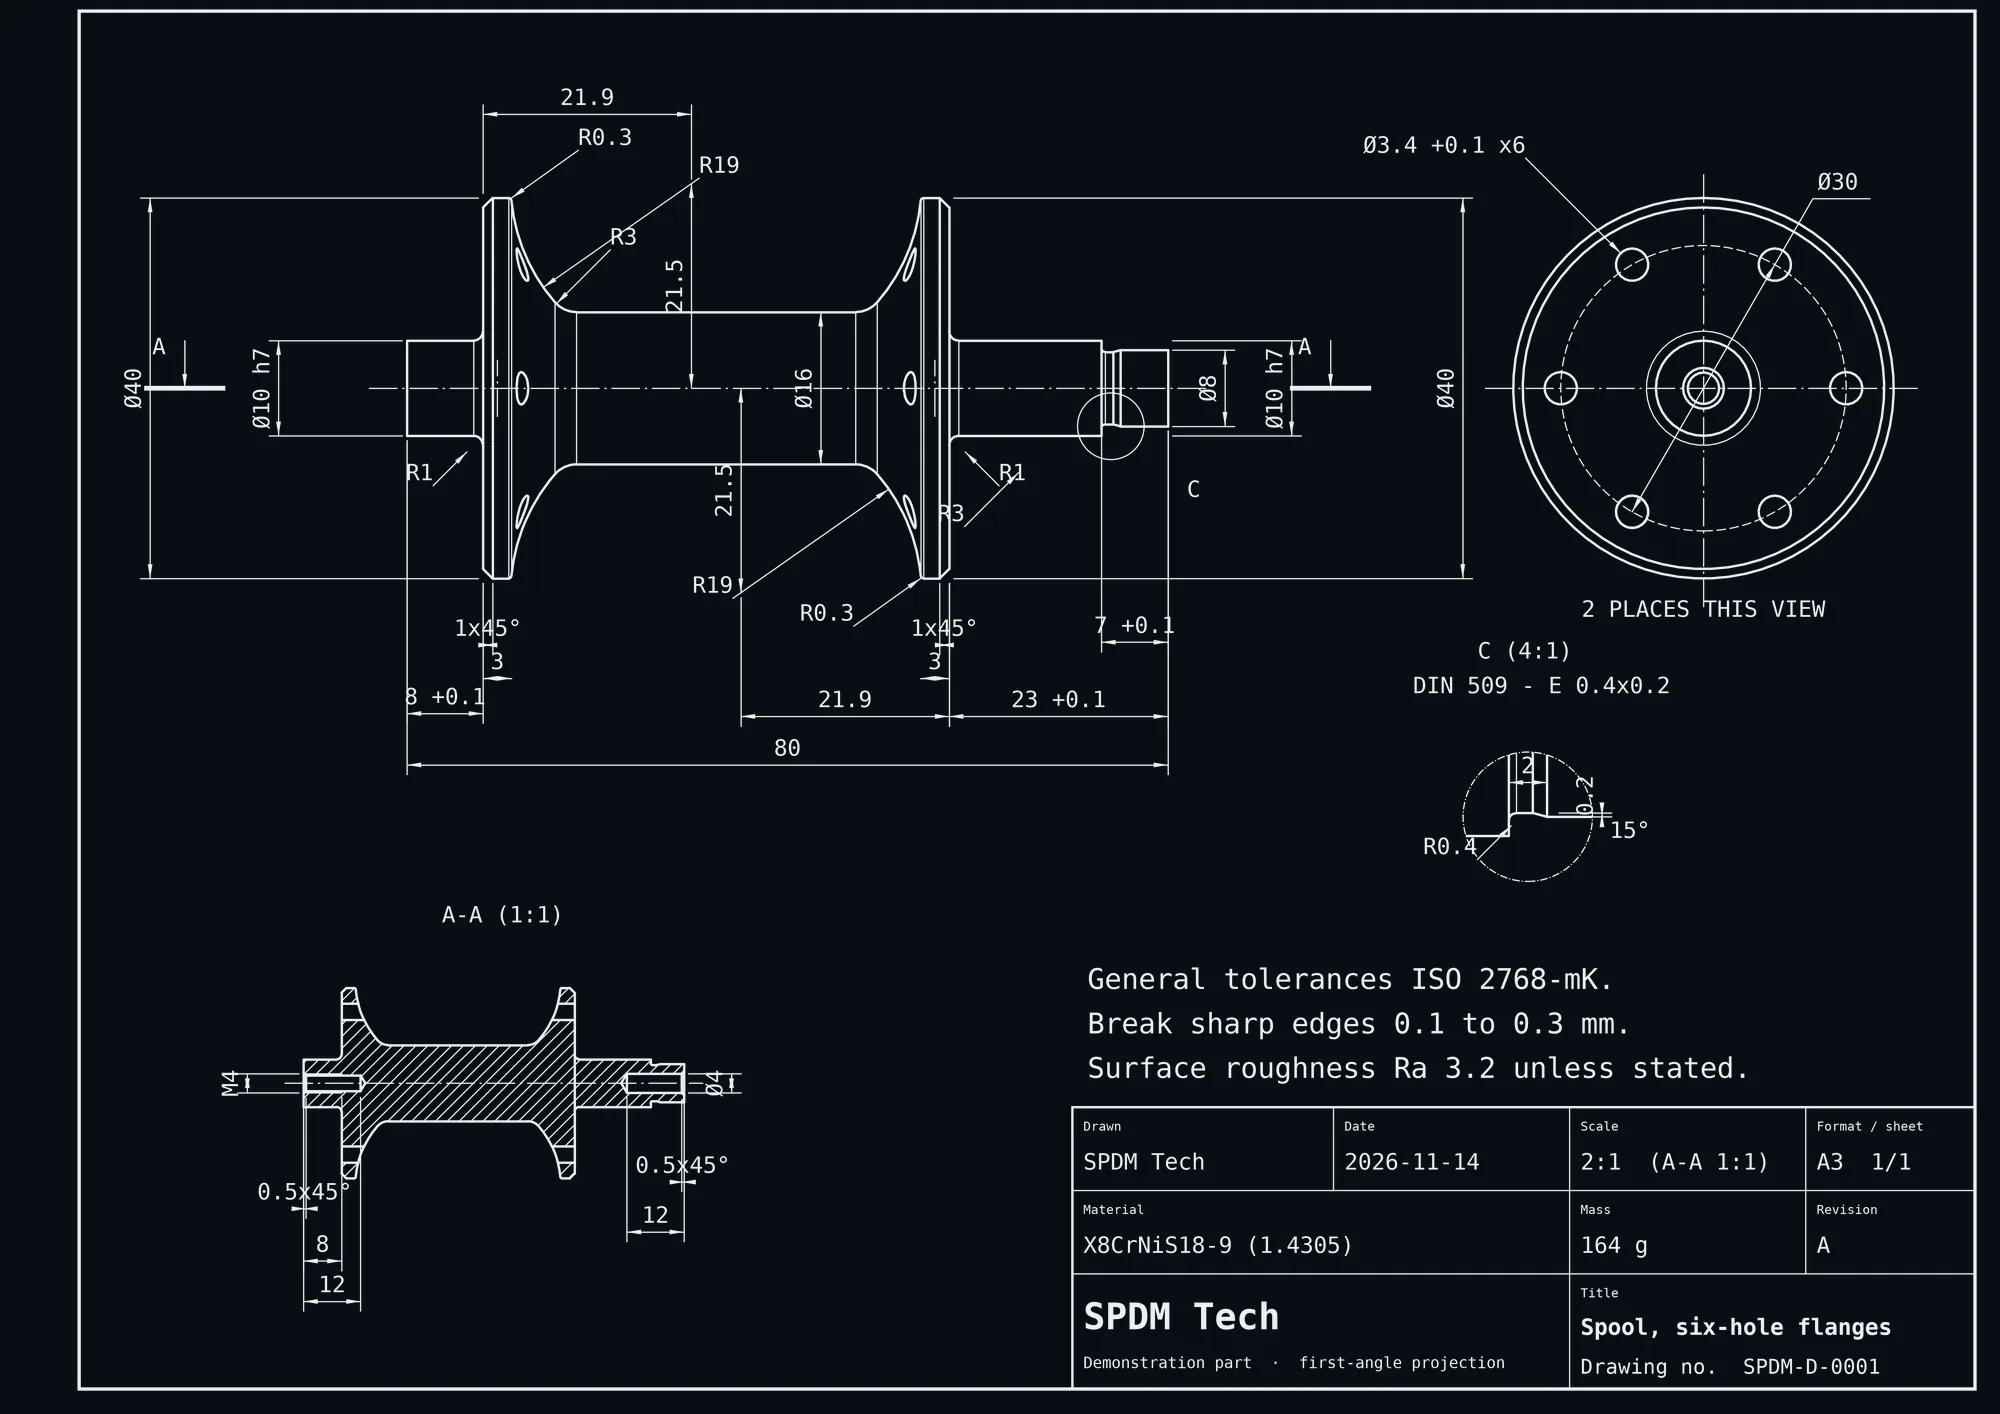
Until now, only 3D master models with PMI counted as machine-readable. Yet most product knowledge still sits in 2D drawings: dimensions, tolerances, materials and notes. AI reads them into parametric 3D models and structured data, and proves every value against the original.
Part, features, dimensions and standards from the drawingAnalyses, results and checks, linked to the features they concern
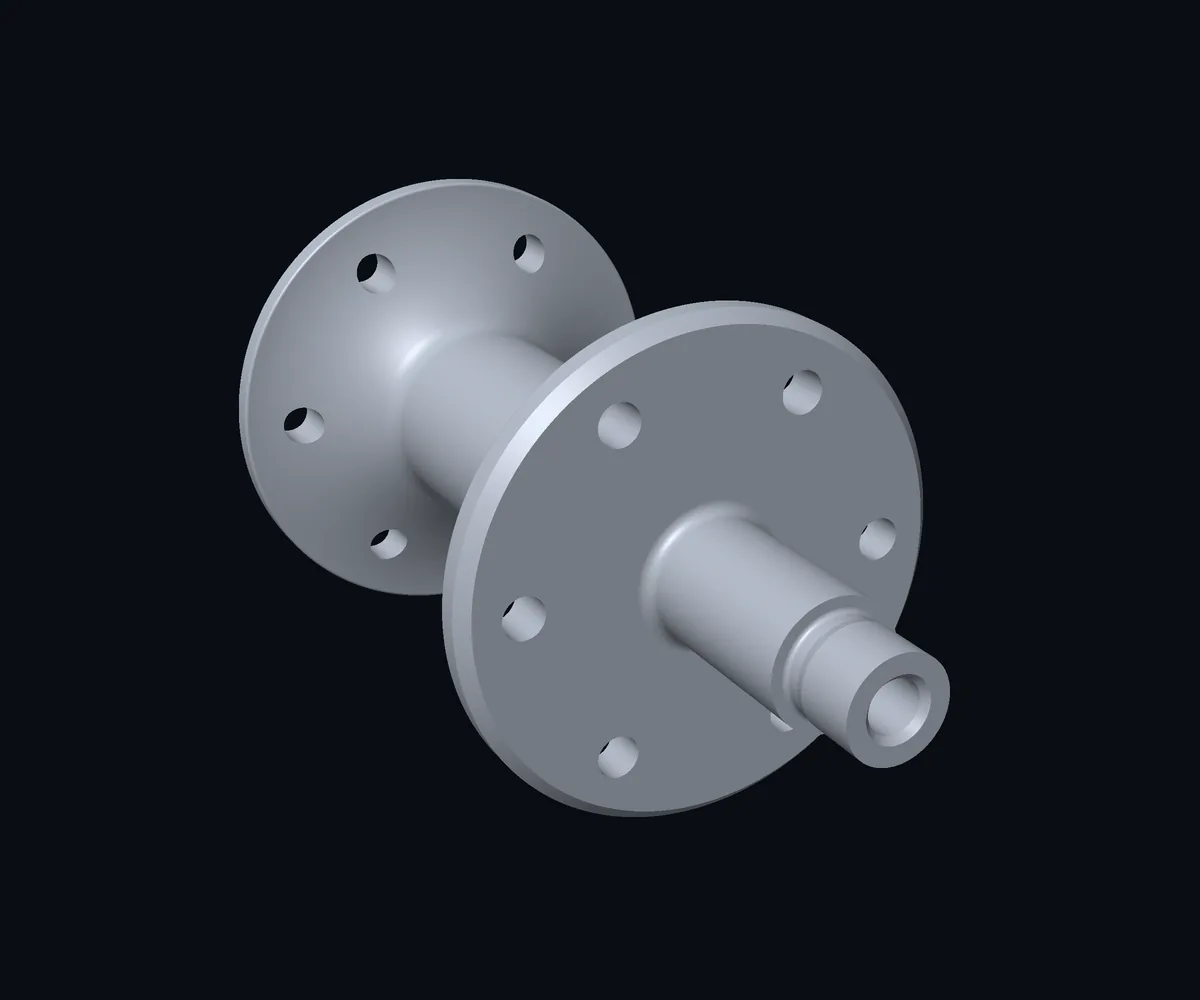
SPDM-D-0001 · Spool, six-hole flanges · an SPDM Tech demonstration part. Drawing and model are one data set.
Tested on third-party drawings
22 of 22Dimensions read from a turned-part drawing and measured on the model: all match
26 of 26On a second drawing, a valve housing
5° vs 10.3°A conflict found in the valve housing drawing: the written angle contradicts its own dimensions
1 · Read
Views, dimensions, tolerances
The drawing is read like a designer reads it: views and sections, every dimension, tolerance class, material and note.
2 · Model
A parametric 3D model
Every value becomes a named parameter in a script. Change one number and the model and its drawing follow.
3 · Prove
Drawn again and compared
The model's own drawing is laid over the original and every dimension is measured. Conflicts in the source are reported, not hidden.
The drawing, as data
What was ink on paper is now a value.
An excerpt of the script behind SPDM-D-0001. Each dimension of the drawing is a named parameter that a program, a check or an agent can read and change.
Most companies hold thousands of released drawings. Read at scale, they show the rules your designers already follow, and where drawings contradict each other. Those rules can then train agents that review new designs.
1 · Read every drawing
From archive to data
Each drawing becomes a model and a structured record of dimensions, tolerances, materials and notes, checked against the original.
2 · Derive the rules
Patterns across parts
Preferred radii, tolerance classes, standard undercuts and hole patterns emerge from the set, together with the exceptions.
3 · Put them to work
Agents that know your standards
New drawings are checked against your own rules before release, and agents propose standard features while designers work.
Reading, modelling and checking single drawings is shown above. Deriving rules across a whole archive is the next step, built with your drawings.
The evidence
Every answer comes with what management needs to judge it.
269 MPa
The risk is located: one small radius carries the peak, so that is where a design change pays off.
Stress concentration at the undercutKt 1.55
Hand check, Ø10 journal40.9 vs 40.7 MPa
9.33 kHz
The lowest natural frequency is known before the first part is made, ready to compare with operating speeds.
Modes computed6
Change with a refined meshwithin 0.4 %
91,172 nodes
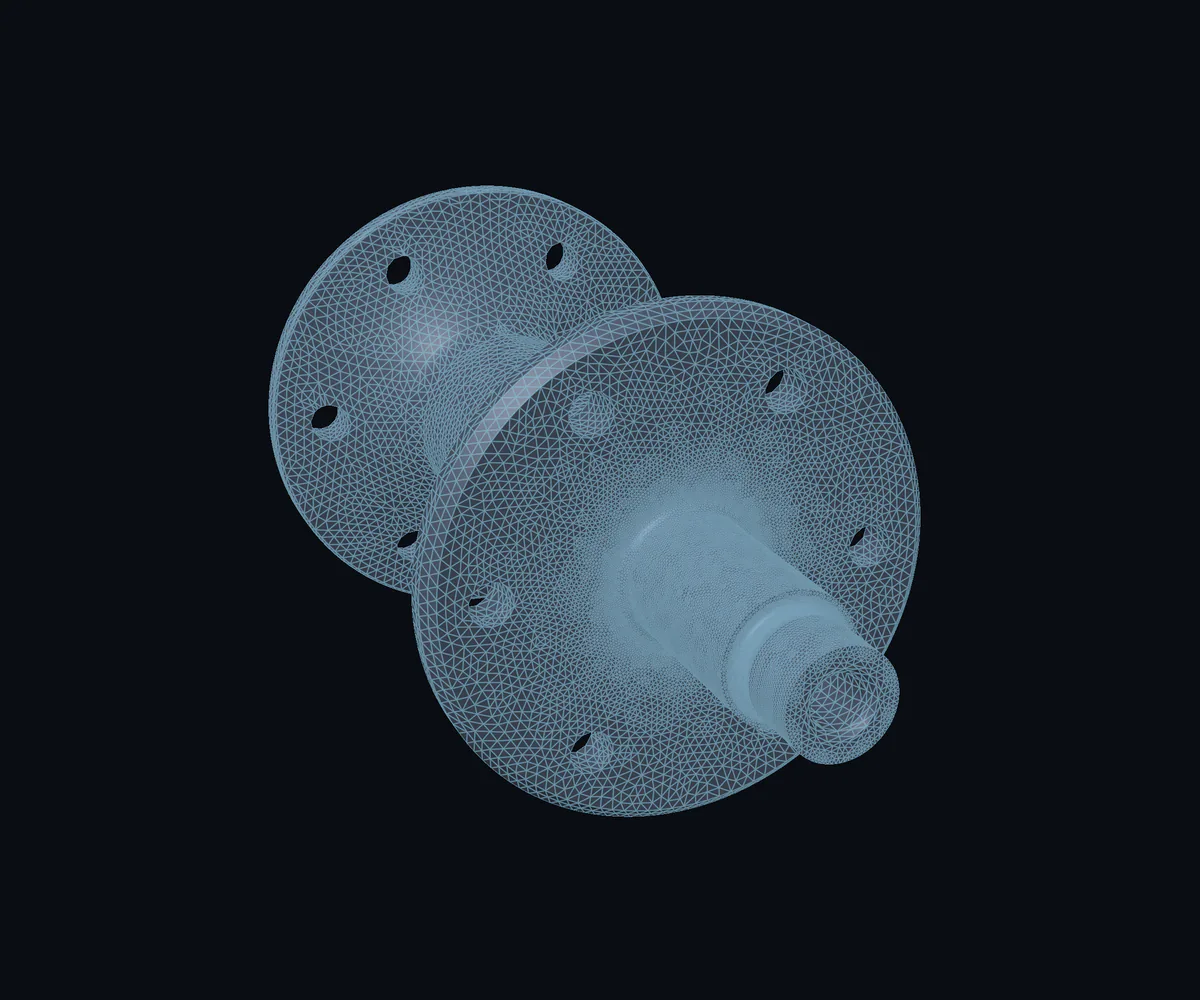
The model is finest where the risk is. Everything behind it is a script, so the analysis can be rerun and reviewed.
Elements, second order54,610
Element size at the undercut0.15 mm
+53.6 K
The hot spot on a circuit board, found straight from its Gerber files and laid over the layout the engineers know.
SPDM Tech is in its build-up phase. As one of the first pilot partners, you bring one real question, from a circuit board, a drawing or a simulation process, and get a checked answer.